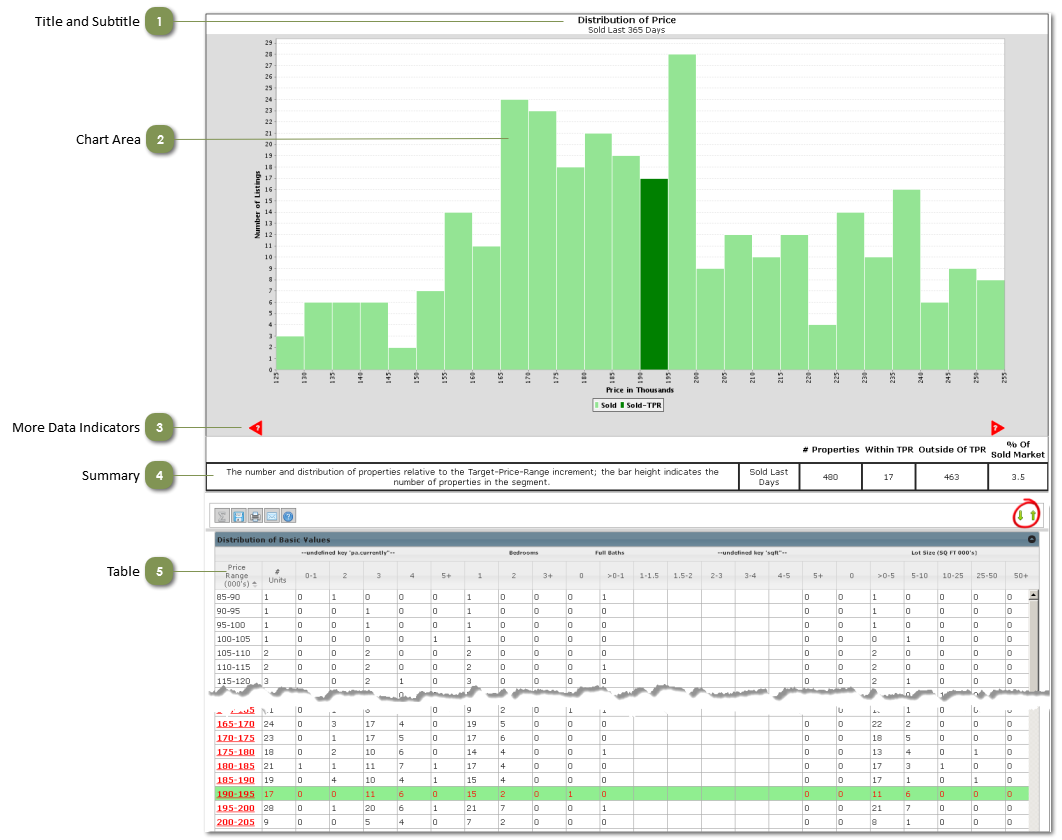
Pricing Analysis search results consist of 3 reports that produce market-wide pricing information and 2 reports that focus on the Target Price Range.
Each report consist of these basic components:
 Title and Subtitle
The title indicates the metric that is depicted on the chart.
The subtitle states the time period(s).
|
|
 Chart Area
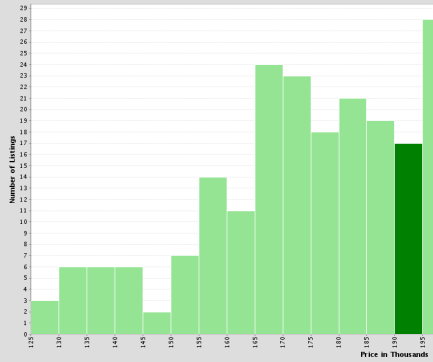
On the Each chart bar represents a period of time (month or quarter) while the height of the bar indicates its value for that time period.
|
|
 More Data Indicators
Red symbols at the left and right edges of the chart tell you there is additional data that is not plotted on the chart. Hover your mouse over them for a summary of the data that is out of view; click on the symbol to scroll the chart to bring the additional bars into view.
|
|
 Summary
This area provides a short description of the chart and summarizes the data that is plotted.
|
|
 Table
Click on the up arrow to view a table of the data that is plotted on the chart, along with additional information.
Click on the down arrow to view the chart.
|
|


