|
|
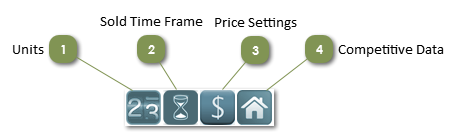
Chart controls allow you to overlay additional information on the chart and table views.
 Units
The Units figure indicates how many properties in each price range groups in table data.
| |
 Sold Time Frame
This control allows you to choose the most appropriate date range for sold properties (Last 365 Days is the default).
| |
 Price Settings
The Price control has two settings: Price Changes and Suggested Price
Price Changes
Allows you to display only properties with no price changes, properties one or more price changes, or all properties. The All Properties blend is the default selection.
Suggested Price
Allows you to display your recommended price point and how it relates to other properties within the Target Price Range. If you entered a Suggested Price on the search screen, it will be displayed here. You may enter or change the number. Select the check box to display a vertical line on the chart at the point that represents the suggested price.
| |
 Competitive Data
This control allows you to display additional information on certain charts:
|
On this chart:
|
Competitive Data includes this information:
|
|
Distribution of Price
|
The number of Sold (closed escrow), Under Contract (contingent and pending), and For Sale (current inventory) properties in each price segment.
|
|
Market Size
|
The number of properties sold in the last 365 days, and the number of properties sold in the 365 days previous to the last 365 days.
|
|
Market Pricing
|
The median price of properties sold in each price segment during the last 365 days and during the 365 days previous to the last 365 days.
|
|
Target Price Range
|
The Sold (closed escrow), Under Contract (contingent and pending), and For Sale (current inventory) properties in the target price range.
|
| |
|
|