Market Dynamics search results consist of 10 reports that measure key market sales conditions over the time period chosen.
Each report consists of the elements shown below.
 Title and Subtitle
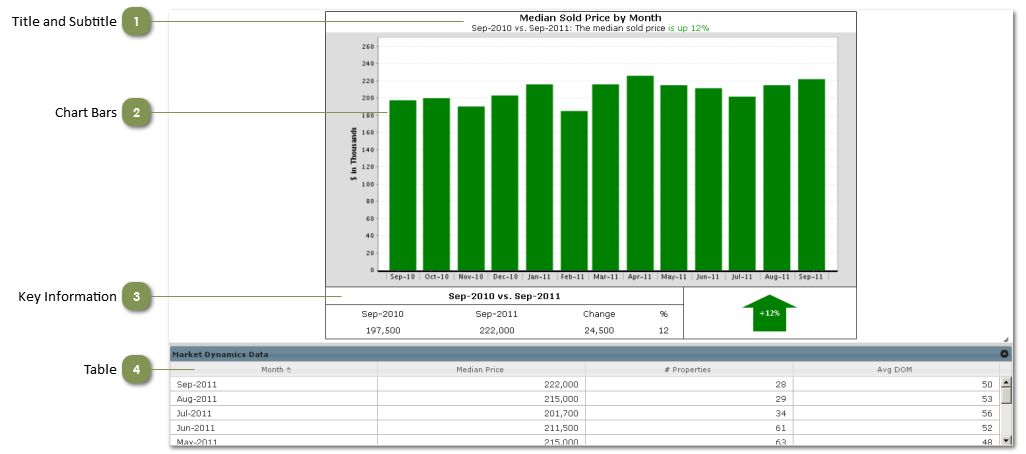
The chart title indicates what is being measured (in this example, the median price of sold properties) and the time period (months).
The subtitle states the percentage of change between the first period's value and last period's value.
|
|
 Chart Bars
Each chart bar represents a period of time (month or quarter) while the height of the bar indicates its value for that time period.
|
|
 Key Information
This area displays the values for the first and last time periods, the difference between the two values, and the difference as a percentage of the beginning value. The arrow shows at a glance the direction of change.
|
|
 Table
The table displays the data that supports the chart. There is one row for each time period (month or quarter) reflected on the chart.
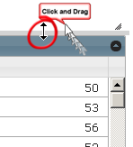
Click on the gray line and drag it to display more or fewer rows of the table:
Click on the arrow to hide or display the table:
|
|


