|
|
Target Price Range Reports
 Title and Subtitle
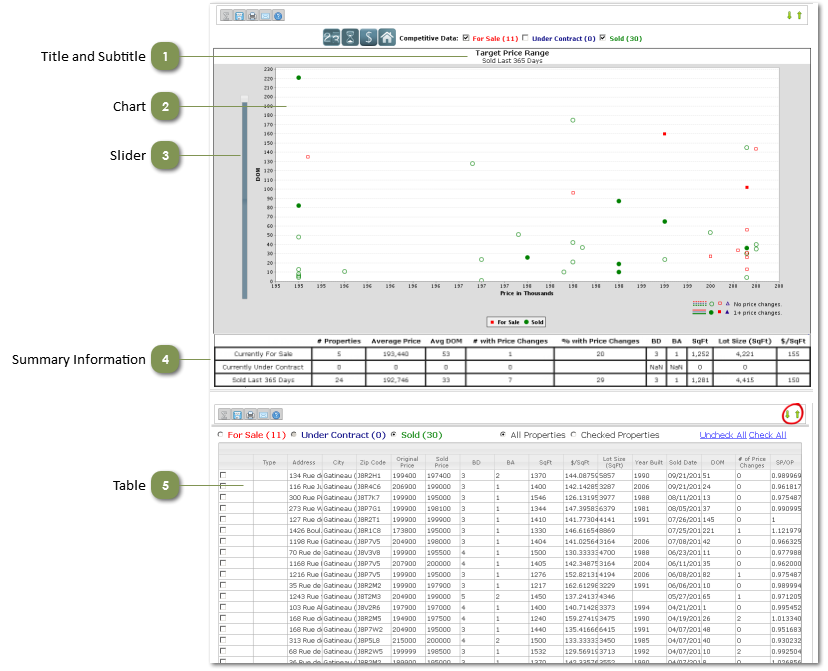
The title indicates the main focus of the chart.
The subtitle states the status of the properties included in the chart data and the time period(s) that are covered.
| |
 Chart
Each symbol represents a property within the Target Price Range.
The horizontal (X) axis spans the Target Price Range that was entered on the search page.
The vertical (Y) axis represents the number of Days on Market.
| |
 Slider
Properties with a high DOM that aren't really comparable to your client's property can distort the overall picture of the market. The slider at the left edge of the chart allows you to remove such outliers from the chart.
| |
 Summary Information
The table below the chart summarizes data that is plotted on the chart, and provides additional information to give you a complete, at-a-glance picture of the current market in the target price range.
| |
 Table
Click on the up arrow to view a table of the data that is plotted on the chart, along with additional information.
Click on the down arrow to view the chart.
Each row in the table provides information on a listing that is plotted on the chart. Listings are grouped by status; click on the radio buttons above the table to see different groups of listings.
| |
|
|
