| < Previous page | Next page > |
Chart and Table Display Options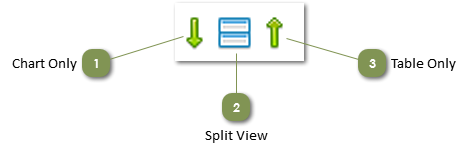
Click on a Display icon to change the chart and table display area
|
|
|
|
|
|
|
TODO: Change the footer's content in Project Settings : HTML (CHM) Export : Setup HTML Template and Layout
|

 Displays only the chart, with no table visible below it.
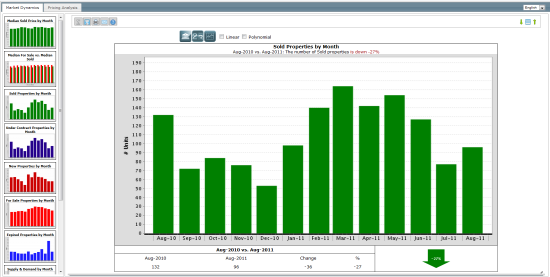

 Displays the full chart and the table of data below it. Use the scrollbar to see rows in the table that are not visible. (The split view is available only in Market Dynamics.)
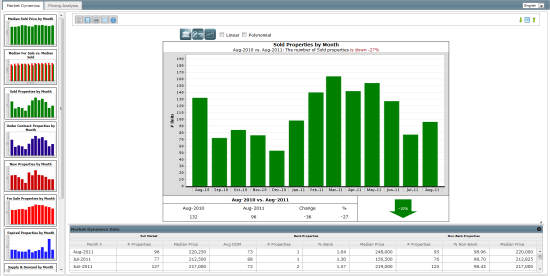

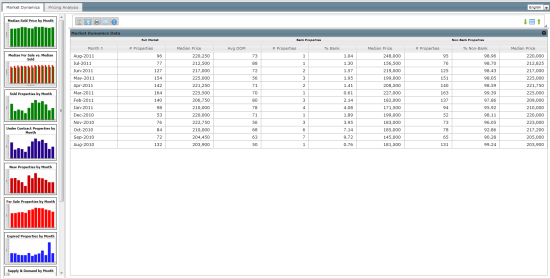
 Displays only a table of the data that supports the chart.